Real-time Monitoring for AdGuard Home Sync: A Production Enhancement

Table of Contents
When you’re running high-availability DNS across a Proxmox cluster, you need to trust that your configuration stays synchronized. I use AdGuard Home Sync to keep my primary and replica DNS servers in sync every 5 minutes, but I had a problem: how do I know it’s actually working without SSH-ing into the server to check logs?
So I built real-time monitoring for it. Took about 6 hours from start to production deployment.
The Problem: No Visibility into Sync Status
I run a 4-node Proxmox cluster at home for DNS, media services, and development environments. AdGuard Home is my DNS solution, and AdGuard Home Sync handles the synchronization between instances perfectly. It’s a solid Go application that syncs configurations on a schedule.
But there was a gap: no real-time visibility.
Want to know if syncs are running? SSH into the server and grep logs:
journalctl -u adguardhome-sync | grep "Sync done"That doesn’t scale. I needed a dashboard.
The Solution: Live Monitoring API and UI
I built two pieces:
- Backend (Go): REST API endpoint with sync schedule metadata
- Frontend (JavaScript): Real-time countdown timers and progress bar
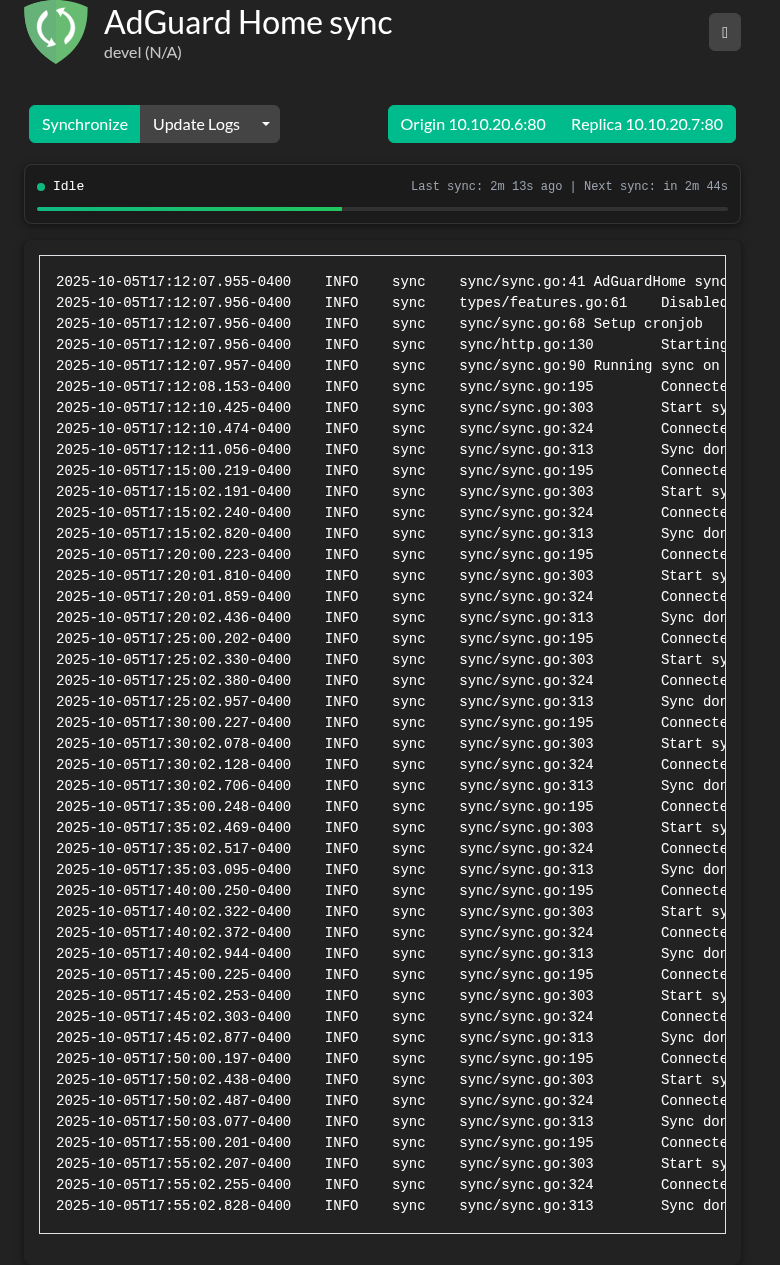
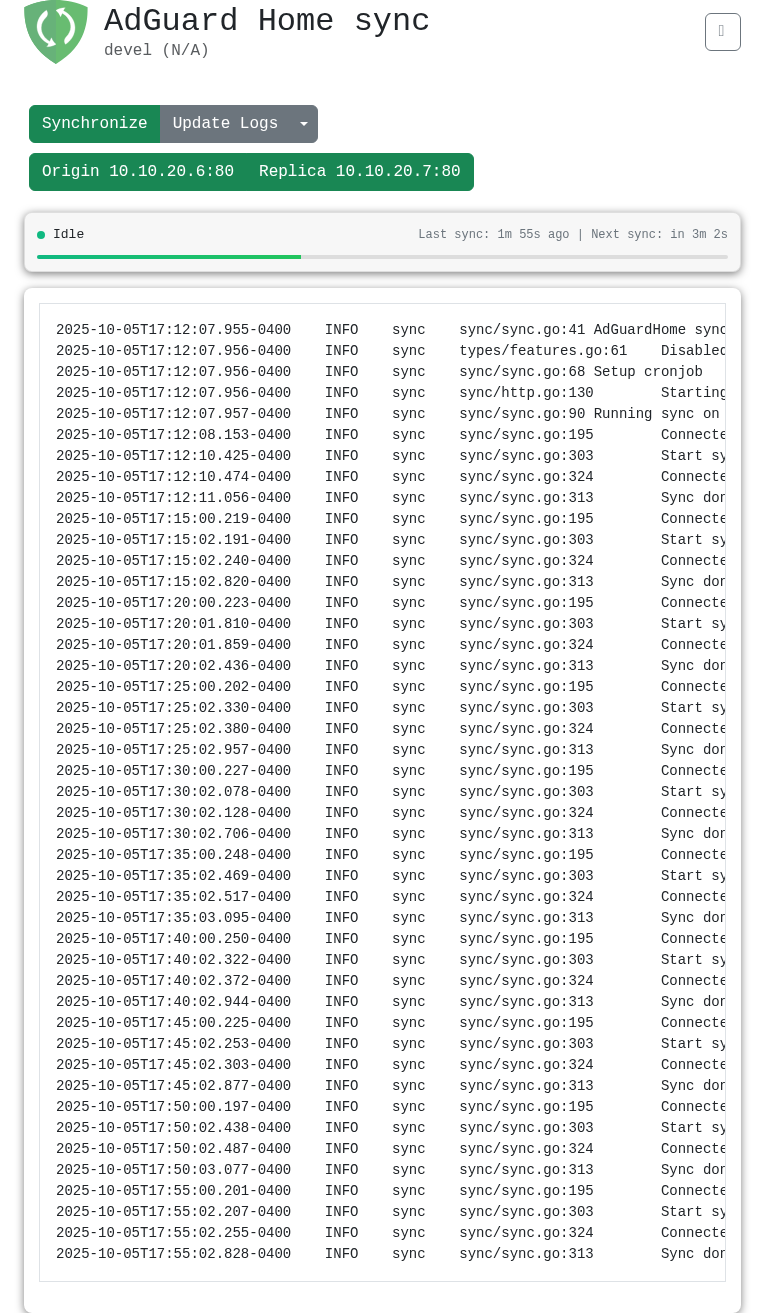
Now I can see sync status at a glance without touching a terminal.

Backend: Exposing Sync Schedule Data
The existing codebase already tracked sync times in the worker struct. I just needed to expose it through an API. The key was making zero breaking changes.
I added a struct to track sync operations:
type syncSchedule struct {
    LastSyncTime    time.Time `json:"lastSyncTime"`
    NextSyncTime    time.Time `json:"nextSyncTime"`
    SyncRunning     bool      `json:"syncRunning"`
    CronExpression  string    `json:"cronExpression,omitempty"`
    IntervalSeconds int       `json:"intervalSeconds"`
}
The new GET /api/v1/sync-schedule endpoint returns this data:
{
  "lastSyncTime": "2025-10-05T17:55:02.828704495-04:00",
  "nextSyncTime": "2025-10-05T18:00:00-04:00",
  "syncRunning": false,
  "cronExpression": "*/5 * * * *",
  "intervalSeconds": 300
}
The intervalSeconds field is calculated dynamically from the cron expression using robfig/cron/v3, so it works with any schedule—every 5 minutes, every hour, whatever.
Frontend: Real-time Updates Without Framework Bloat
The project already used jQuery and Bootstrap. No reason to add React or Vue when you don’t need it.
The frontend polls on two intervals:
- Every 30 seconds: Fetch fresh data from the API
- Every 1 second: Update countdown timers and progress bar
Progress bar calculation is straightforward:
const timeSinceSync = (Date.now() - lastSyncTime) / 1000;
const progress = Math.min((timeSinceSync / intervalSeconds) * 100, 100);
I also threw in dark mode with localStorage persistence. The UI works seamlessly in both themes:


Debugging a 2-Pixel Layout Shift
After implementing the theme toggle, I noticed the “Trigger Sync” button was shifting position when switching themes. Just a couple pixels, but it bugged me.
I used Playwright to measure exact element positions in both themes:
- Light mode
<h1>height: 64px - Dark mode
<h1>height: 66.2px
Bootstrap’s light and dark themes have different line-height values for headings. Fixed it with CSS normalization:
h1 {
  line-height: 1.2 !important;
  margin: 0 !important;
  padding: 0.5rem 0 !important;
}
Sometimes you just need to measure things instead of guessing.
Production Deployment: Same Day
From idea to production: about 6 hours.
- Planning & codebase review: 1 hour
- Backend implementation: 2 hours
- Frontend implementation: 2 hours
- Debugging layout shift: 30 minutes
- Documentation: 30 minutes
Deployed to my Proxmox cluster as a systemd service. The compiled Go binary is lightweight:
- Memory usage: ~6.3 MB
- CPU usage: <1% average
- Sync frequency: 288 syncs/day (every 5 minutes)
- Average sync duration: ~1.4 seconds
- Uptime: 100% since October 5, 2025
It’s been rock-solid managing critical DNS infrastructure.

Why Fork Instead of Upstream Contribution?
I forked bakito/adguardhome-sync (Apache 2.0 license) and created my own fork with proper attribution. Why not contribute upstream?
Simple: I needed this feature today.
- Upstream contribution takes time—review, discussion, iterations
- My implementation works for my use case but might need refinement
- Forking is what open source is for—anyone can enhance tools for their needs
I documented everything in FORK.md and IMPLEMENTATION.md. If the maintainer wants to discuss a pull request, I’m happy to. But I’m equally comfortable maintaining this independently.
What I Learned
A few things stood out from this project:
Read the code first. I spent an hour understanding the architecture before writing anything. Worth it—I knew exactly where to make changes without breaking things.
Work with what’s there. The project used jQuery and Bootstrap. Adding React would have been pointless. Use the existing ecosystem unless you have a good reason not to.
Dependencies are liabilities. Every new dependency is a potential security issue and maintenance burden. I built this without adding a single library.
Document as you go. I created FORK.md, IMPLEMENTATION.md, and screenshot guides. Future me will appreciate it.
Production validates everything. Local testing is fine, but nothing proves a feature works like running it in production. Since October 5th, this has monitored 288 DNS syncs per day without issues.
Wrapping Up
This project shows what you can do when you focus on solving actual problems instead of over-engineering. I enhanced a mature tool, deployed it same-day, and now have real-time visibility into my DNS infrastructure.
Nothing exotic here—Go, JavaScript, jQuery, Bootstrap. No revolutionary approach—REST API, polling, client-side calculations. But it works, it’s maintainable, and it’s running in production.
That’s what matters.
Project Links
- My fork: github.com/eddygk/adguardhome-sync
- Upstream project: github.com/bakito/adguardhome-sync
- Portfolio: eddykawira.com
If you’re working on similar infrastructure challenges or have questions about Go/JavaScript development, feel free to reach out.