It Wasn't the Heat. It Was (Probably) the RAM.

Table of Contents
My workstation is my daily Windows 11 machine, and it also hosts my homelab. When it crashes, it takes my lab, my backups and my websites down with it.
So when it started crashing, I took it personally.
The setup and the crashes
The hardware is nothing exotic: an 8-core Ryzen desktop CPU (Zen 3), an air tower cooler, and 64 GB of DDR4 as four 16 GB sticks rated for 3600 MT/s.
The CPU itself was at stock: everything on Auto, no PBO tuning, no Curve Optimizer. The one thing I had turned on was A-XMP (Profile 2, I believe), which ran the memory at its rated 3600. On Ryzen that also means the Infinity Fabric clock (FCLK) runs at about 1800 MHz to stay 1:1 with the RAM.
The first crash in the logs was October 21, when the machine went down unexpectedly five times in one day. It happened again on October 23, October 30, twice on November 2, and on November 4. Each time the PC became unresponsive with no video. There was no blue screen, and my self-hosted sites went down with it. After the second crash on November 2 the PC stayed down until the next afternoon.
On October 21 and November 2, Event Viewer had the same thing waiting for me: a WHEA-Logger Event ID 18, a fatal hardware error. It reads like this, and the details pointed at the CPU's internal cache, a machine check from bank 5:
A fatal hardware error has occurred.

Reported by component: Processor Core
Error Source: Machine Check Exception
Error Type: Cache Hierarchy Error
The other crashes left only Windows' "previous system shutdown was unexpected" entries, with no error detail at all.
What I thought it was
Heat. I'd seen CPU temperatures in the high 80s and low 90s, and that looked bad. I was working through it with an AI assistant, and its first read agreed with mine: too hot. To be fair, that is a reasonable first suspect.
So on November 4, on the AI's suggestion, I went into the BIOS and put a leash on the CPU:
- Precision Boost Overdrive (PBO) set to Advanced with manual limits: PPT 88 W, TDC 60 A, EDC 90 A
- A platform thermal limit of 80 °C
- Curve Optimizer off
- A-XMP off
With XMP off, the RAM fell all the way back to its JEDEC default, DDR4-2133. My 3600 kit was jogging.
The AI's other suggestion was a repaste. On November 9 I pulled the cooler, cleaned off the old paste, reseated the CPU and applied fresh thermal paste.
Even at light load the numbers looked warm. After the repaste, LibreHardwareMonitor showed 74 °C at about 19% load, and the AI flagged that as hot for so little work. After a BIOS reset (more on that below) it read 65 °C at 9%. The catch is that this chip boosts one or two cores to full speed in short bursts, which the total load percentage hides. So 65 to 74 °C at light load is the warm end of normal on an air tower (typical idle is more like 45 to 60 °C). Still, those numbers are a big part of why heat looked guilty.
The accidental reset
Afterward I wanted my memory speed back, so I turned A-XMP on at 3600 again. The machine wouldn't POST. I had to pull the CMOS battery to get back in, which reset the whole BIOS to defaults. Goodbye power limits and 80 °C cap.
That failed boot turned out to be the best clue of the whole saga. I settled on a conservative middle ground. In the BIOS advanced mode, under the overclocking and DRAM settings:
- A-XMP Profile 1, then manually set DRAM Frequency to 3200
- FCLK to 1600, so the Infinity Fabric stays 1:1 with the memory
- Save and exit
Everything else is at default. It booted, and Task Manager reports 3200 MHz.
Ruling out heat
Then I ran Cinebench R23, not for a score but as a stress test. The point was to pin every core at 100%, push temperatures as high as they would go with stock CPU settings, and see whether the machine stayed up or started throttling.
With the cap gone, the chip went straight to about 90 °C Tctl, holding about 4.2 GHz across all cores at around 119 W, with no throttling and no crash.
That is a Ryzen doing exactly what it's designed to do. It boosts until it reaches its thermal target, then holds there. About 90 °C under an all-core load is normal for this class of chip on an air cooler.
What it most likely was
If heat wasn't it, what changed between "crashing" and "stable"? Not the CPU settings. Those were stock before the crashes, and they're stock again now. The November 4 throttling never fixed anything, because the CPU settings were never the problem.
What did change was the memory. Four 16 GB sticks at 3600 with FCLK at 1800 is a lot to ask of a Zen 3 memory controller and Infinity Fabric. Some chips handle it. Plenty don't. And when the Infinity Fabric is marginal, it often doesn't look like a memory problem. It shows up as WHEA Event ID 18 cache or machine-check errors that make the CPU look like it's failing.
The failed POST at 3600 fits that picture, and so does the clean run at 3200.
The honest scorecard:
| What I thought | What it most likely was |
|---|---|
| The CPU is overheating | About 90 °C under full load is the normal boost target |
| Heat is causing the crashes | Memory at 3600 with FCLK at 1800 was too much for this setup |
| Throttling the CPU will fix it | Stock CPU settings were never the issue |
| New paste will fix it | Good hygiene, and it helped rule heat out |
I'm saying "most likely" on purpose, because I haven't proven it. The PC has only been at 3200 since November 9, so that test has just started. The real test is the next week or two with no new Event ID 18 errors. If they come back, the plan is to drop the RAM to 2933 or 3000, then update the BIOS, and only then start suspecting the CPU itself.
The gap: I just wanted to see the number
Through all of this, every time I wanted to know how hot the CPU was, I had to open a full monitoring tool, scroll a tree of sensors and find the right line. That is fine for a deep dive and overkill for "is it hot right now?"
I got tired of launching LibreHardwareMonitor or my motherboard vendor's utility just to check the CPU temperature. I wanted a way to see it at a glance.
My first question to Claude was whether my motherboard vendor's utility could drive a little desktop widget. It can't: the vendor tooling has no public developer API. AMD, on the other hand, publishes a free, documented, read-only Ryzen Master Monitoring SDK. That settled it, and the two of us built CPU Temperature Widget on top of it.
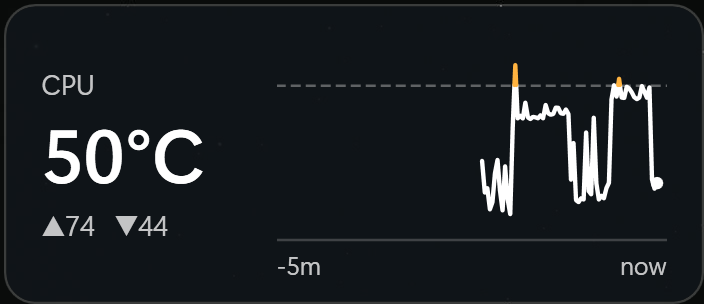
It is deliberately small:
- A big number with the current CPU temperature. It is white below 70 °C, amber from 70 to 85 °C, and red at 85 °C and up.
- A graph of the last five minutes, with dashed lines at 70 and 85 and the high and low for that window.
- It floats on the desktop, you can drag it anywhere, and a right-click gives you always-on-top and a 1, 2 or 5 second refresh rate.
- If it can't read the sensor, it shows
--instead of a stale number. Hover over it and it tells you why.
Under the hood it is a WPF app on .NET 10 that reads the temperature through AMD's SDK. A tiny C++ DLL wraps the SDK so the C# side can call it. It never touches the network. It needs administrator rights, because AMD's SDK loads a driver to read the sensor. It is Ryzen-only and MIT licensed, and the repo has 37 unit tests and CI.
The bug that proved the point
During the first all-core load test, a call into the AMD SDK simply never returned. The window stayed responsive but kept showing the last reading, 67 °C, as if it were live. That is exactly the lie I built this thing to avoid.
A stack dump showed the worker thread stuck inside native SDK code. I still don't know why. It didn't happen again in two more loaded runs, and the widget now runs every SDK call on one dedicated thread with a five-second timeout. If a read hangs, it shows -- and says the SDK isn't responding. I contained the problem rather than root-causing it, and the README says so.
Installing it
Two steps. First, download AMD's free SDK and run its installer. AMD makes you accept its licence yourself, and its terms don't allow redistribution, so the widget's repo and installer contain no AMD files. Second, run the widget's installer from the releases page. Windows will warn you because the installer isn't code-signed; this is a hobby project. The release page lists the file's SHA-256 so you can check what you downloaded.
I installed it on my own machine from the public release. It worked the first time, and it has been on my screen since.
What I'd tell you
- See WHEA Event ID 18 on Ryzen? Check XMP and FCLK first. Infinity Fabric instability is a common cause, and it disguises itself as a CPU fault.
- Look up your chip's normal temperature before you panic. For this class of Ryzen, about 90 °C under an all-core load is the boost target, not a fire.
- Four sticks at 3600 is asking a lot. If XMP won't POST or you're getting WHEA errors, try 3200 with FCLK 1600.
- A stress test is for stability, not score. A full all-core run that stays up, holds its clocks and doesn't throttle tells you more than a scary-looking number.
- Want lower idle temps? Use Eco Mode (65 W) or a more aggressive fan curve.
- Change one thing at a time. I changed the CPU limits, the RAM speed and the paste in the same stretch, and it took an accidental BIOS reset to untangle them.
- If a tool annoys you every day, build the small version. Building it with Claude turned "where's that sensor again?" into a widget that is always on my screen.
The code is at github.com/eddygk/cpu-temp-widget. I have only tested it on my own Ryzen desktop, so if you run it on a different Ryzen, open an issue and tell me how it went.
Table of Contents

About Eddy Kawira
Infrastructure Engineer & AI Systems Architect with 20+ years across IT systems, data center operations, and cloud architecture. Experience ranges from high-scale AWS data center deployments (Trainium2) and enterprise Azure Virtual Desktop migrations to building open-source AI agent tooling (ClawHub) used by 10,000+ developers. Runs a battle-tested hybrid Proxmox VE and Hyper-V homelab focused on reliability, deep observability, and safe automation.
View all posts by Eddy Kawira →